Falling stock and bond markets, along with the rising volatility which has gripped global markets since the start of the year, have intensified in recent days.
Last week’s announcement of annual US inflation of 8.6%, the highest in 40 years, was the primary cause. The chart below illustrates both the recent increase of CPI as well as the composition of contributions to US inflation.
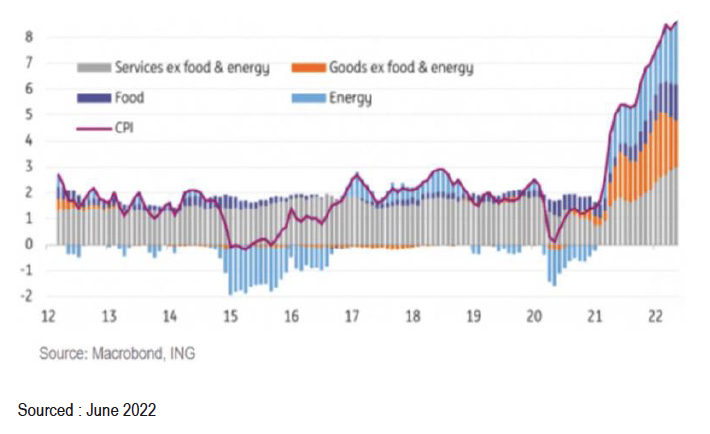
Energy, food, and services have all contributed to the rise in US inflation. Reduced supply and increasing demand factors are pushing prices higher. Regarding energy, there has been significant supply constraints due to the conflict in Ukraine along with greater demand as the US holiday driving season ramps up. Food prices have also been affected by the costs of production (increased fertiliser costs) and transportation. Services costs have risen as demand increases as the economy reopens and consumers recommence travel and other related activities. In the last three months alone, airfares have risen 48%.
US Federal Reserve (Fed)
In response to the rising inflation the central bank, the Fed, has made it clear that they seek to return inflation to its target of 2% p.a. The Fed is also aware that if inflation continues to rise, workers will likely seek additional wage rises to compensate for the higher costs of living. The danger then becomes a wage price spiral. If wages increase too quickly then the producers of goods and services raise their prices to maintain their profit margin, which then feeds into further wage rises. This potentially results in higher inflation becoming entrenched.
The Fed will meet later this week, with market expectations that at least a half a percentage increase in the official rate is likely.
Reserve Bank of Australia (RBA)
At its June meeting the Australian central bank, The RBA, also responded to higher-than-expected domestic inflation, with an increase of 0.5% in the official cash rate target. It was the largest upward move since February 2000. This brings the cash rate target to 0.85%. In its statement following the decision, the RBA also called out rising power and petrol prices, as contributing to inflation from the previous month. Both the Fed and RBA, along with other central banks, have made it clear that they will continue to raise rates to tame inflation and bring it down to the targets they have set.
Market Reaction
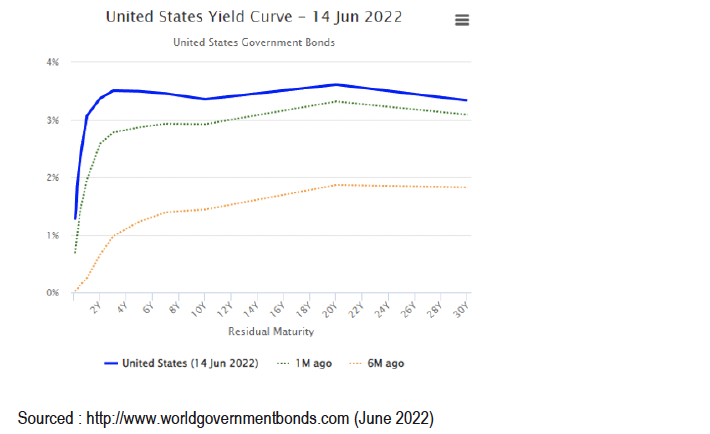
Following these central bank’s statements, markets are increasingly concerned that the rate hikes required to tame inflation could depress economic growth, resulting in a recession. One indicator that has preceded recessions in the past is an inverted yield curve. This simply means that longer term interest rates fall below shorter term rates. This is illustrated by the blue line in the chart below, where the current 2-year government bond rate is above the 10-year rate. Historically, an inverted yield curve has been a good, albeit not infallible predictor of a recession 12-18 months later.
International Equities
Markets that were already under stress prior to last week’s inflation rate, responded quickly and sold down further as the market reassessed company’s future earnings prospects in a higher inflation, higher interest rate environment. The following charts show both the Nasdaq and S&P 500, over 1 week and 6 months, with their corresponding drawdown.
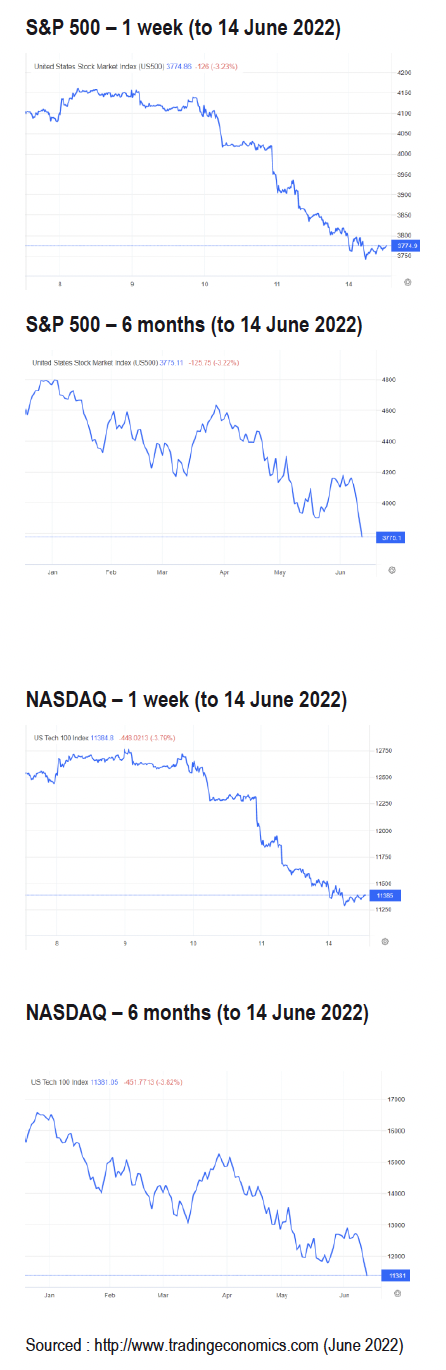
Falls in recent days have seen the S&P 500 move officially into a “bear market” (market falls of 20% or more). The NASDAQ, which comprises predominantly “growth” stocks, has been particularly hard-hit. The main reason for this is that growth stocks are expected to deliver a higher proportion of future cashflows in the distant future and are therefore more sensitive to interest rate rises. The future cash flows are worth less in today’s terms as interest rates (discount rates) increase.
Australian Equities
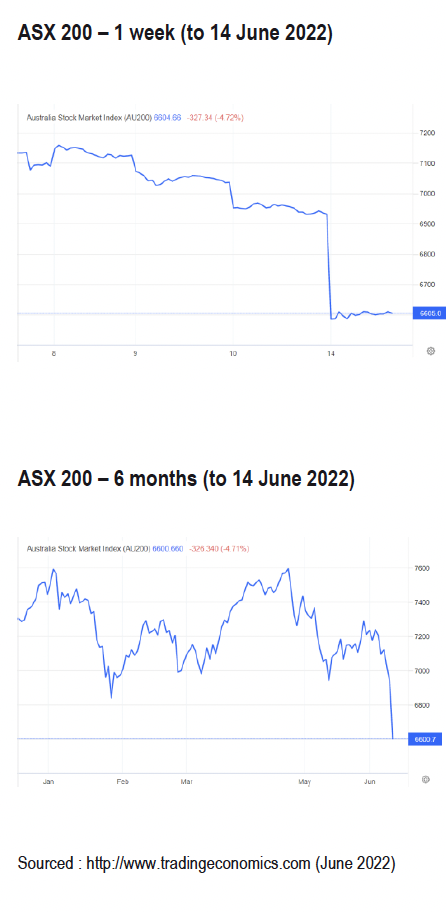
Both global markets and domestic factors influence the Australian stock market. Whilst earlier in the year the market fared relatively better to its overseas counterparts, market sentiment began to change following the April RBA meeting. At this meeting, the RBA began to suggest that rates may have to move higher as inflationary pressures were building. These market concerns were realised in the May meeting, when the official cash rate rose by a quarter of a percent, and then in June with the half a percentage rise.
The following charts show the ASX 200, over 1 week and 6 months, with their corresponding drawdown. The one week drawdown was compounded by the US market falls. Overall the market has fallen around 12.5% from its peak 6 months ago.
Fixed Income
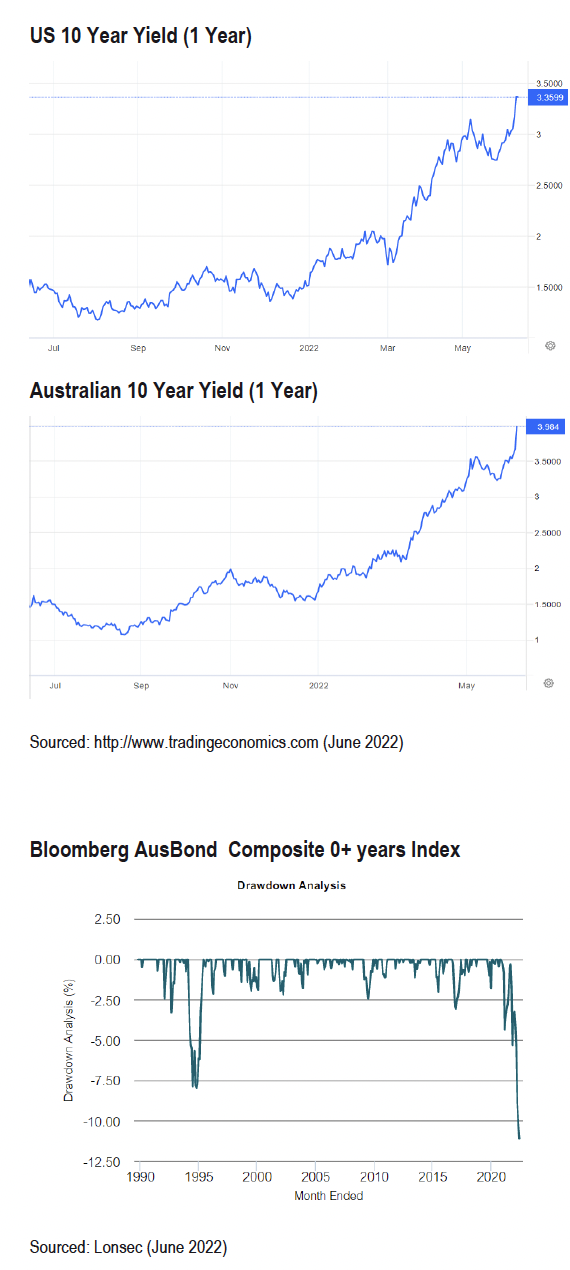
Fixed income markets have also responded to rising inflation and interest rates. If yields rise rapidly (responding to higher interest rates), the value of a fixed interest investment falls. This is because the fixed yield on an existing investment, is now lower on a relative basis, and therefore considered less attractive, than a new investment which attracts a higher yield. Australian and US yields have surged in 2022, with both 10-year Government Bond rates rising to well over 3%. In Australia the Ausbond Composite Index, which is the most common measure of the Australian Fixed Interest market, is down approximately 10.8% from the start of the year to 10 June, whilst the global equivalent, the Bloomberg Global Aggregate (AUD Hedged), is down approximately 11.5% from the start of the year until 10 June 2022. These are the largest corrections seen in this asset class in the last 40 years and eclipses the 1994 bond market sell-off.
The following charts illustrate the rise in Australian and US yields over the past year, and the drawdown in the Ausbond Composite Index since 1990.
Outlook
We appreciate that the current environment looks concerning given falls in markets and likely further interest rate rises. There have also been reports comparing the current period to previous episodes of rising inflation and interest rates. It is worth examining two previous periods of rising inflation and interest rates. These two periods are the 1970’s through to the early 1980’s, and 1994. Whilst it is difficult to make direct comparisons as the global economy and markets have evolved since these periods, it is still worthwhile to identify similarities and differences which can assist in thinking about the market outlook.
In the 1970’s, economies were impacted by oil price shocks, causing inflation to surge. Geopolitical issues in the 1970’s were mainly responsible. As a result, central banks at the time were much more strident in taming inflation, and rates moved well into the double digits. In the US interest rates reached 20% by late 1980. This resulted in the recession of 1981-1982, and US unemployment reached nearly 11% in late 1982. However, economies were much more rigid at that time and the rising inflation resulted in significant wage rises becoming much more entrenched. This is not the case today. As labour markets have become more flexible in recent decades the likelihood of wages increasing at the same rate is diminished.
The Fed also embarked on a series of interest rate increases primarily to ward off inflation in 1994. However, there are a few key differences with now. In 1994, whilst inflation was rising, it hadn’t risen to the current levels. Policymakers, however, fretted that a strong economy would translate into much higher inflation. The Fed doubled interest rates over a 12-month period to 6% - at one point executing a three quarters of a percent hike. The speed and degree of the rate rises took markets by surprise and resulted in significant drawdown in fixed income markets. Current economic conditions today are more sensitive to interest rate movements, given higher indebted levels, an ageing demographic, slower population growth, and lower economic growth. Central banks are aware of these conditions and as a result, whilst seeking to reduce inflation, will also likely be conscious of the market impacts.
Importantly, we do see inflation likely moderating over the next 12 months. A range of factors particularly around supply side constraints such as ongoing Covid impacts particularly in China and energy prices have been key drivers in the current inflation numbers. We expect these constraints to ease in coming months. This in turn would likely improve the outlook for rates, bond markets, and equities.
In addition to Geopolitical factors listed above, we see that the current inflation environment has been largely caused by massive increases in the money supply just after the Covid crisis. Two and a half years later, the lagged impacts of those money supply increases are showing up in rising prices for goods, services, real assets and commodities.
As the Covid crisis unfolded and the world controlled the situation, the growth rate in money supply was drastically reduced. This may mean that large increases in inflation this year may be followed by a moderation in prices in 2023 and beyond, as the lagged effect of those subsequent money supply decreases flow through next year.
What to do?
The volatility that we've seen over the last six months, while significant, is not an unusual occurrence for a normal and healthy functioning market. Despite being an uncomfortable experience in the short term, equity markets will continue to be an important contributor to overall long-term returns.
It is important to continue to stay invested and manage your portfolio in line with your long-term objectives, aligned to your risk tolerance. We would encourage investors to discuss their portfolio with their adviser to ensure that it meets their personal needs, objectives and is in line with their risk tolerance.
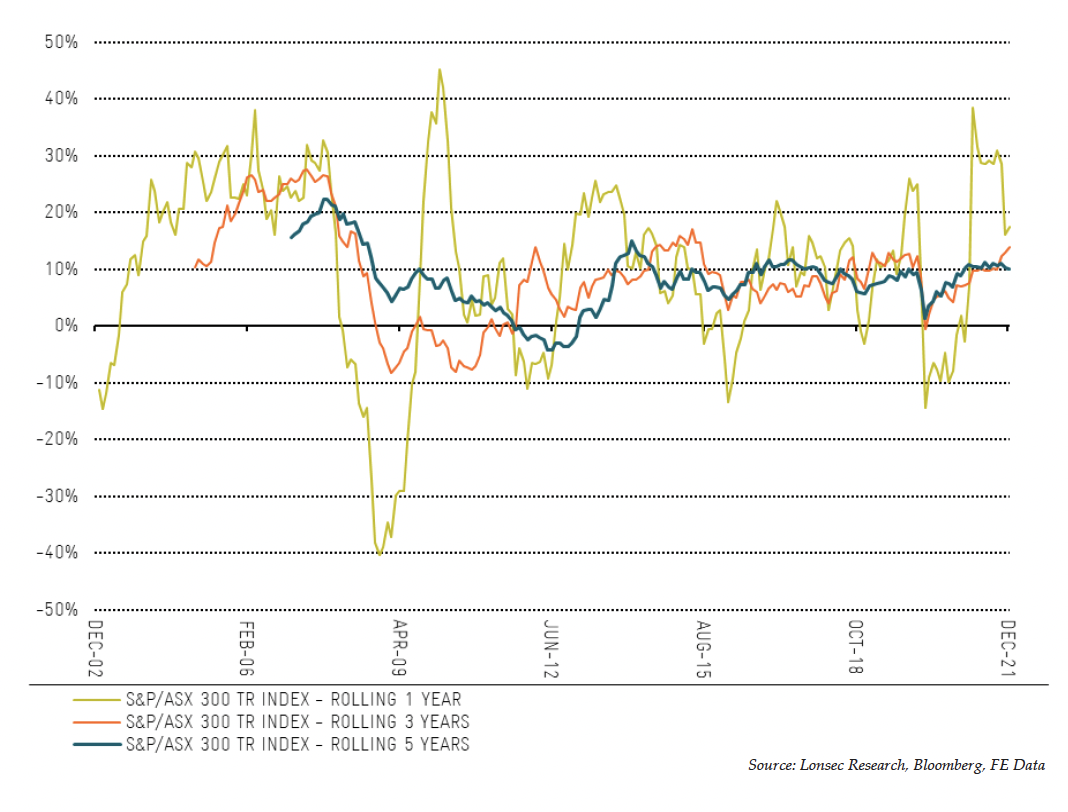
One of the important lessons in investing is that time in the market, is more important than timing the market. The following chart demonstrates that whilst short term movements in markets (in this case the ASX 200) can be extremely volatile (as we have witnessed in the past 6 months), investing for the longer term (the blue line) provides a much more stable outcome. As we continue working through this period of heightened volatility, keeping the longer-term in mind remains important.
Disclaimer: The information in this report is general advice only and does not take into account the financial circumstances, needs and objectives of any particular investor. Before acting on the advice contained in this document, you should assess your own circumstances or seek advice from a financial adviser. Where applicable, you should obtain and consider a copy of the Product Disclosure Statement, prospectus or other disclosure material relevant to the financial product before making a decision to acquire a financial product. It is important to note that investments may go up and down and past performance is not an indicator of future performance.
Authors: – Alex Harris & Ross Stanley (Research Analyst), Andrew Ash (Senior Manager)
Approved By: – Matt Olsen, Head of Research and Retirement Income
Research Analyst Disclosures:
I, Alex Harris, Ross Stanley and Andrew Ash, hereby certify that all the views expressed in this report accurately reflect my personal views about the subject investment theme and/or company securities. I also certify that no part of my compensation was, is, or will be, directly or indirectly, related to the specific recommendations or views expressed in this report. I, Alex Harris, Ross Stanley and Andrew Ash, and/or entities in which I have a pecuniary interest, have an exposure to the following securities and/or managed products mentioned in this report: Nil
Important Information
This report is prepared by Bridges Financial Services Pty Limited ABN 60 003 474 977 AFSL 240837 (Bridges). Bridges is an ASX Market Participant and part of the IOOF group of companies. This report is prepared by the IOOF Research team for:
Bridges Financial Services Pty Limited ABN 60 003 474 977 AFSL 240837, Consultum Financial Advisers Pty Ltd ABN 65 006 373 995 AFSL 230323, Millennium3 Financial Services Pty Ltd ABN 61 094 529 987 AFSL 244252, RI Advice Group Pty Ltd ABN 23 001 774 125 AFSL 238429, Shadforth Financial Group Ltd ABN 27 127 508 472 AFSL 318613, Godfrey Pembroke Group Pty Ltd ABN 38 078 629 973 AFSL 245451 (‘Advice Licensees’). The Advice Licensees are part of the IOOF group comprising IOOF Holdings ABN 49 100 103 722 and its related bodies corporate (IOOF group).
The Advice Licensees and/or their associated entities, directors and/or employees may have a material interest in, and may earn brokerage from, any securities or other financial products referred to in this document, or may provide services to the company referred to in this report. The document is not available for distribution outside Australia and may not be passed on to any third person without the prior written consent of the Advice Licensees.
The Advice Licensees and associated persons (including persons from whom information in this report is sourced) may do business or seek to do business with companies covered in its research reports. As a result, investors should be aware that the firms or other such persons may have a conflict of interest that could affect the objectivity of this report. Investors should consider this report as a single factor in making an investment decision.
The document is current as at the date of issue but may be superseded by future publications. You can confirm the currency of this document by checking the intranet site (links below).
The information contained in this report is for the sole use of advisers and clients of AFSL entities authorised by the Advice Licensees. This report may be used on the express condition that you have obtained a copy of the Advice Licensees Financial Services Guide (FSG) from their respective website.
The contents of this report should not be disclosed, in whole or in part, to any other party without the prior consent of the IOOF Research Team and Advice Licensees. To the extent permitted by the law, the IOOF Research team and Advice Licensees and their associated entities are not liable for any loss or damage arising from, or in relation to, the contents of this report.
For information regarding any potential conflicts of interest and analyst holdings; IOOF Research Team’s coverage criteria, methodology and spread of ratings; and summary information about the qualifications and experience of the IOOF Research Team please visit https://www.ioof.com.au/adviser/investment_funds/ioof_advice_research_process