We are happy to present our quarterly review of the mid-market Initial Public Offerings (“IPOs”) on the Australian Securities Exchange (“ASX”).
The focus of the analysis is on the current quarter and the immediately preceding 12 months with the aim of providing you with an overview of the current mid-market IPO activity.
In our analysis we have looked at IPOs that had an enterprise value of less than $200m at the time of listing. We have also provided some further detail on the cost of IPOs broken down by market capitalisation, and the performance of IPOs occurring in the last 12 months by significant sectors.
Key highlights are:
- There were 27 IPOs for mid-market companies in the quarter, an increase on last quarter and an increase on the same period last year as the market continues to recover after COVID 19.
- The mining related sectors were again the most active sectors in the quarter with 19 IPOs.
- Mid-market companies raised $208.5 million on the ASX in the quarter.
- The average IPO fundraising was $7.7 million, which is a 43% decrease on the previous quarter, and a 40% decrease on the 12-month average.
- On average, transaction costs (excluding brokerage fees) increased by 2.5% to $0.25 million.
Overview
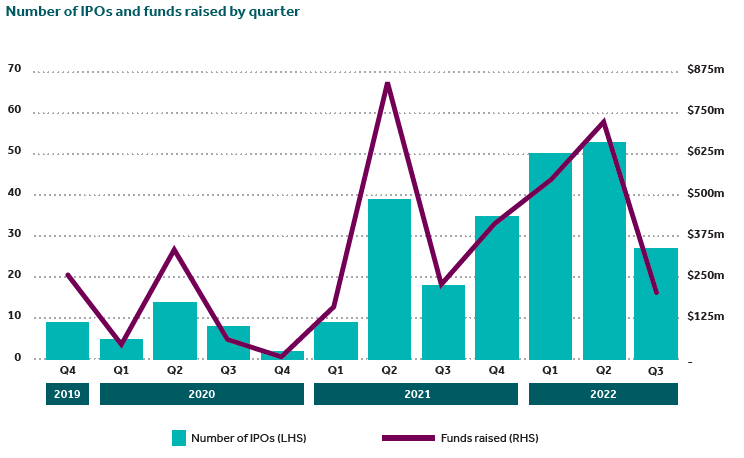
There were 27 IPOs in the mid-market this quarter, a 49% decrease from last quarter, but a 50% increase compared to the same quarter last year (Q3 2021).
Total funds raised in the quarter was $208.5 million, a 71% decrease from last quarter, but a 10% increase compared to the same quarter last year. The average funds raised per transaction this quarter was down by 43% from $13.6 million last quarter to $7.7 million, and a 40% decreased compared to the same quarter last year.
This quarter has seen the 12-month average funds raised per transaction decrease by 7%.
The average enterprise value at IPO in the quarter was $25.6 million, which was down 36% from last quarter and down 46% from the same quarter last year.
Quarterly Activity
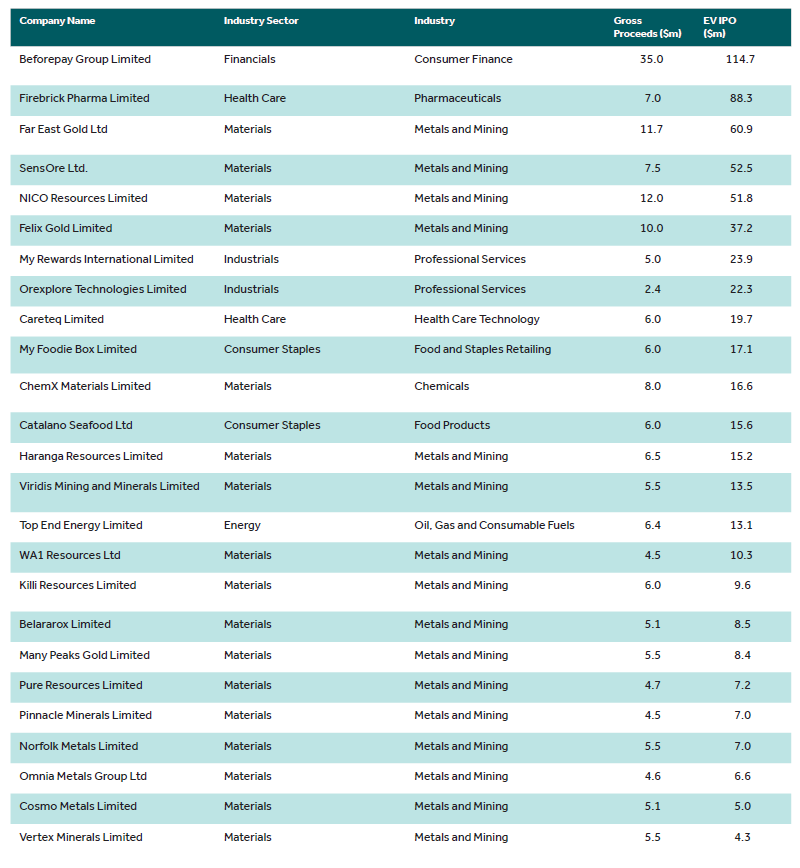
There were 19 IPOs within mining related sectors, followed by 2 IPOs within the healthcare, consumer staples and industrials sectors, and 1 IPO each in the financials and real estate sectors. There were no IPOs in the consumer discretionary, communications, utilities and information technologies sectors.
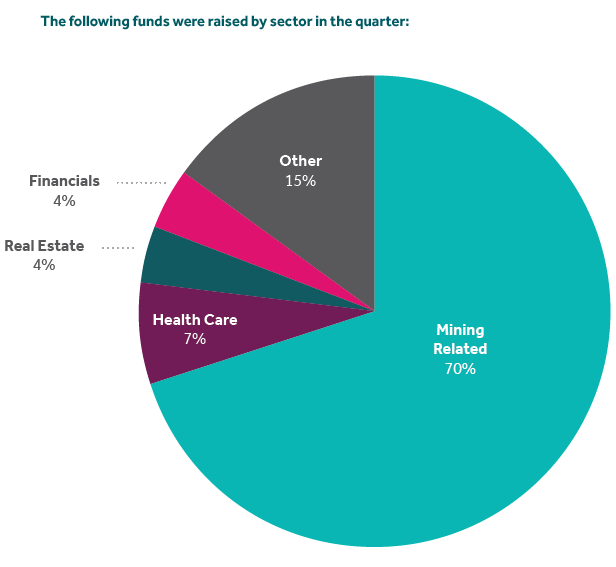
Of the $208.5 million raised during the quarter, the mining related sectors recorded the highest value of funds raised at $119.1 million, followed by financials at $35.0 million and real estate at $15.5 million.
Sectors
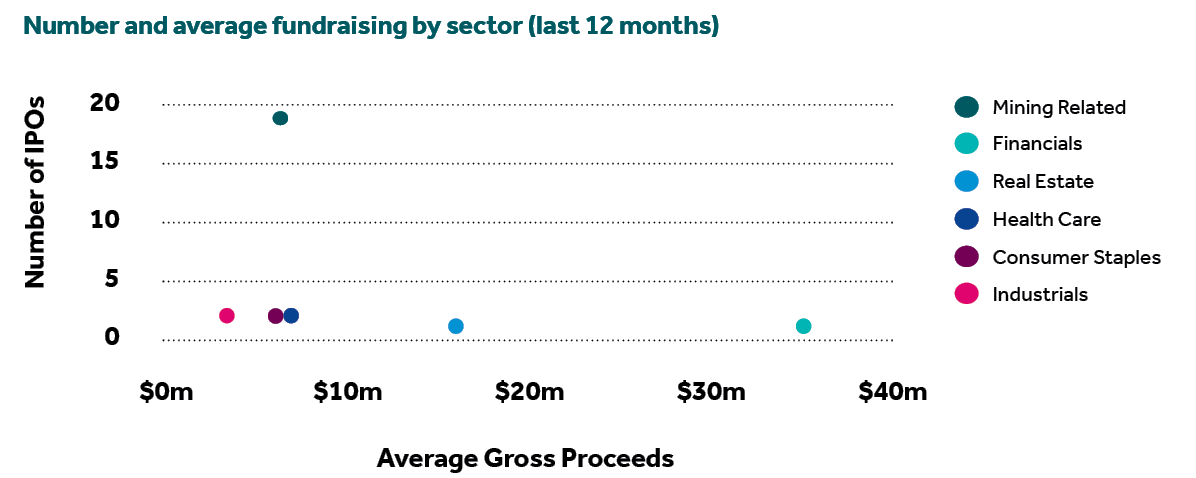
We have analysed the number of IPOs and average fund raising per sector over the last quarter in order to better understand the activity in each sector.
Mining related sectors were the most active sectors with 19 IPOs and average funds raised of $6.6 million per transaction.
The Financials sector only had 1 IPO this quarter but the average finds raised was the highest of all sectors at $35 million, followed by the real estate sector which had average funds raised of $15.5 million with only 1 IPO. The healthcare sector had 2 IPOs with average funds raised of $6.5 million, the consumer staples sector had 2 IPOs with average funds raised of $6 million, and the industrials also had 2 IPOs with average funds raised of $3.7 million.
There were no mid-market IPOs in the consumer discretionary, communications, utilities and information technology sectors during the quarter.
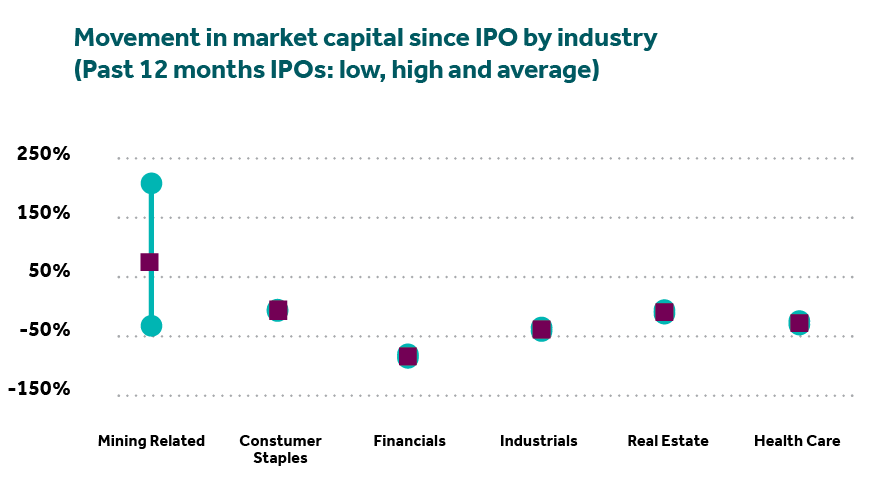
Performance over the last 12 months
Mining related sectors were the most volatile sectors with a spread of returns of 285% and average returns of 13%.
The consumer staples sector was relatively volatile with a spread of returns of 20% and negative average returns of 20%, followed by the industrials sector with a spread of returns of 9% and negative average returns of 43%. The healthcare sector had a spread of returns of 5% and negative average returns of 31%.
The financials and real estate sectors were less volatile with negative average returns.
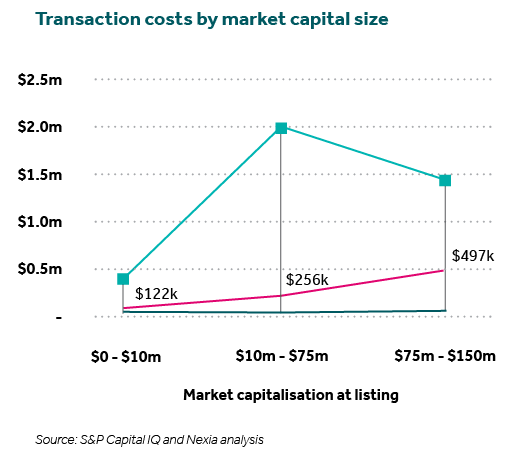
Costs
Certain costs in undertaking an IPO, being accounting and legal costs, are typically fixed regardless of the outcome. Fundraising costs, on the other hand, are generally paid on successful completion of the IPO and represent a percentage of proceeds raised. Accordingly, fundraising costs have been excluded from our analysis.
A number of factors will impact the costs incurred, including how prepared the company is for the IPO, the complexity of its business and whether there are any related transactions. Over the last year, the fixed costs for an IPO have averaged $245,653 compared to $239,646 for the corresponding 12-month period in the prior year.
We note there were no transactions during the quarter within the $150m-$200m market cap range.
Methodology
The analysis was prepared based on data sourced from S&P Capital IQ. Data analysed is for completed IPOs on the ASX, from 1 January 2022 to 31 March 2022, with an implied enterprise value of less than $200m. If no implied enterprise value was disclosed at the IPO filling date, transactions were adjusted to be the first enterprise value disclosed within the preceding 90 days.
Of the 27 transactions analysed for transaction costs there was sufficient data for 93% of the transactions to calculate the average accounting fees per transaction and there was sufficient data for 100% of the transactions to calculate the average legal fees per transaction.
If you would like to discuss further any of the information provided in this report and how it may impact you, please contact your Nexia Advisor.